
by
Amir Sagy & Ze'ev Reches Institute of Earth Sciences, and Itzhak Roman School of Applied Sciences, Hebrew University, Jerusalem 91904, Israel
Abstract
We analyzed a system of complex joints in thick dolomite layers that are exposed within the western margins of the Dead Sea basin. These joints display two dominant features: "tree-like" branching and a gradual increase of density that leads to local fragmentation. The development of this joint system is investigated in laboratory experiments with samples of brittle/ductile layered composites. The samples were subjected to layer-parallel extension and displayed three styles of fracturing: Planar fractures, known from previous tests; branching fractures and clustering fractures, observed here for the first time in layered composites. Based on fracture morphology, we deduced that the branching and clustering fractures in the experiments, and the tree-like, closely spaced joints in the field, propagated at dynamic, high-velocity growth rates. It is proposed that the morphological features described here could be used as field criteria to recognize dynamic rates of rock fracturing.
Introduction
Countless fractures appear in the earths crust. Many of them grow unstably and at high velocities as evidenced by earthquakes and rockbursts. However, there is no systematic method to deduce the growth velocity of a fracture from its appearance in the field. Engelder and Fischer (1996) stated that Even though propagation velocity is so important in identifying the joint-driving mechanism, little is known about natural joint velocity. Knowing the growth velocity of fractures is also important for applied problems such as seismic hazard evaluation, rockburst risk and the evaluation of fracture density in layered rocks. Fast growth of fractures is termed dynamic fracturing, a process in which tensile fractures grow at velocities comparable to Rayleigh wave velocity of the host material (Freund, 1990; Ravi-Chandar, 1998; Fineberg and Marder, 1999). In this study we propose field criteria for dynamic fracturing of rocks and relate these criteria to new experimental results reported here.
Estimating joint propagation velocity in the field is not a simple task. One may deduce from explosive experiments that rock fractures associated with catastrophic events, like earthquakes, impacts or rockbursts, are dynamic fractures. Another approach is based on the experimental observations that slow growing fractures are smooth and simple whereas dynamic ones are rough and complex (e.g., Bahat, 1991; Lawn, 1993, Sharon and Fineberg, 1996). Using this approach, some fractographic features associated are suspected as indicating fast propagation. For example, Wallner lines and velocity hackles could indicate high propagation velocity (Kulander et al., 1979, p.26-34).
The first part of the present analysis describes the detailed geometry of joints within an exposure of dolomite layers close to the Dead Sea basin. The second part presents a series of experiments with brittle-ductile layered samples that were subjected to extension, and in which new fracturing styles have been observed. Finally, we suggest that the studied field joints grew at dynamic velocities and discuss the relations between dynamic fracturing and joint density. One should note that the term joint is used here for an extension fracture observed in the field, whereas the more general term fracture is used for a tensile (or shear) fracture observed in laboratory experiments.
Dynamic Fracturing and Fracture Morphology
During slow, quasi-static propagation of fractures, the input of mechanical energy UM is sufficient only for generation of new surface area of the growing fracture,
UM + US = 0
where US is the new surface energy. During fast, dynamic fracture propagation, the input of mechanical energy UM exceeds that necessary to form new surface area and the excess energy accelerates propagation to high velocities,
UM + US + UK = 0
where UK is the kinetic energy of the dynamic fracture system.
Theoretical analyses show that dynamic fractures could accelerate to a
terminal velocity that equals the Rayleigh wave velocity of the host material
(Freund, 1990). In most experiments however, the terminal velocity is smaller
(Schardin, 1959; Ravi Chandar and Knauss, 1984).
Fig. 1. a. A branching system of a dynamic
fracture in glass plate (Schardin, 1959); top view; the fracture propagated
from left to right following a knife impact on the left side. b. General
morphology of a fracture growing in a 40cm by 40cm glass plate subjected
to plate parallel quasi-static extension; ?r is uniform tensile stress.
c. Close up view of fractures in the glass plate (map view); (left) smooth
fractures that grow at velocity below the critical velocity, V < VC;
(center) microbranches that develop when VC ? 0.4VR; microbranches length
and density increase with velocity (right); (after Sharon and Fineberg,
1996).
A few types of geometric features are associated with dynamic fractures; note again that dynamic fracture refers here to fractures growing at velocity V that is comparable to Rayleigh wave velocity, VR. The first type includes the mirror-mist-hackle zonation (Ravi Chandar and Knauss, 1984; Ravi-Chandar, 1998). The smooth, mirror zone forms when the fracture accelerates at a velocity that is less than a critical velocity. In the mist and hackle zones the propagation velocity stabilizes at high value and the fracture surface becomes rough and irregular. The second geometric type includes the branching of dynamic fractures in brittle plates. This process generates large-scale branches that depart from the parent fracture, and propagate away from it (Fig. 1a) (Schardin, 1959; Lawn, 1993). The third type includes microbranches and minute surface roughness observed along dynamic fractures in plates of glass and PMMA (Fig. 1b,c) (Ravi Chandar and Knauss, 1984; Sharon and Fineberg, 1996, 1999). In these tests the fractures are smooth when the propagation velocity V is smaller than a critical velocity VC »0.4VR; microbranches start to develop when V ³ VC (Fig. 1c) (Sharon and Fineberg, 1996). Further, the density of microbranches increases with velocity and the cumulative surface area of a fracture that grows at a terminal velocity of VT»0.7 VR, is six times the surface area of a planar fracture (Sharon and Fineberg, 1996).
In laboratory experiments, dynamic fractures develop under two loading conditions: very high strain rates (? > 103 sec -1) generated by explosions or impacts (Dally, 1979; Ravi-Chandar and Knauss, 1982; Grady and Kipp, 1987); or quasi-static strain rates (? < 10-3 sec-1) associated, for example, with slow extension (Fineberg et al., 1992; Sharon and Fineberg, 1996). In the present paper, we analyze dynamic fractures that form under quasi-static strain-rates of 3.6× 10⁻⁵ sec 1 to 7× 10³ sec 1, and develop tools to recognize dynamic fractures in the field.
General
The fractures analyzed here are part of our regional study of faults and joints in the western margins of the Dead Sea basin (Sagy, 1999). The Dead Sea basin is a 100km long pull-apart between two left stepping segments of the Dead Sea transform (Fig. 2a) (Garfunkel, 1981; Reches, 1987). The 105km of cumulative left-lateral slip along the transform began about 15 million years ago, and led to sediment accumulation in access of 10km (Garfunkel and Ben-Avraham, 1996). On its western side, the Dead Sea basin is bounded by a belt with many segmented normal faults in zigzag pattern (Sagy, 1999; Reches and Sagy, 1999). This belt occupies a region that is more than 100km long, 3-5km wide and with cumulative vertical displacement of up to 10km along its many faults. The faulting within the belt exposes a thick sequence of brittle carbonate rocks with networks of fractures and countless fragments. We studied in detail a highly complex joint system that is exposed within a 120m long outcrop in Arugot stream, central Dead Sea basin (Fig. 2a).
The Arugot outcrop includes sub-vertical walls that are 1.5m to 4.5m in height, which form natural, vertical sections of the jointed layers. The analysis focuses on a 3.3m thick, flat lying layer of brittle, massive dolomite that is capped by a less competent dolomite layer, about 0.3m thick (Fig. 2b). To estimate the mechanical properties of these layers, we used the Schmidt hammer technique following the procedure of Katz et al. (2000). This procedure transforms elastic rebound values measured in the field into the Young modulus, uniaxial strength and density of rocks. The results for the 3.3m thick, massive dolomite layer indicated Young modulus o34 ± 6 GPa and uniaxial strenof 109 ± 30 MPa. The overlying 0.3m thick dolomite layer is significantly less competent: Young modulus of 12 ± 3 GPa and uniaxial strength of 34 ± 6 MPa.
We mapped the exposure of vertical section at scale of 1:20, and selected
portions at scales of 1:10 and 1:2; some individual joints were mapped
at 1:1 scale on enlarged photographs. Both layers are fractured by one
set of subvertical joints that trends in NNE-SSW direction (Fig.
2c, d); this set is one of the two dominating regional sets (Sagy,
1999; Reches and Sagy, 1999). The extensional nature of these joints is
evident by the occurrence of ribs and hackles, and lack of shear displacements.
This exposure is bounded on its eastern side by a large normal fault that
is one of the main boundary faults of the Dead Sea basin; its vertical
displacement apparently exceeds hundreds of meters.
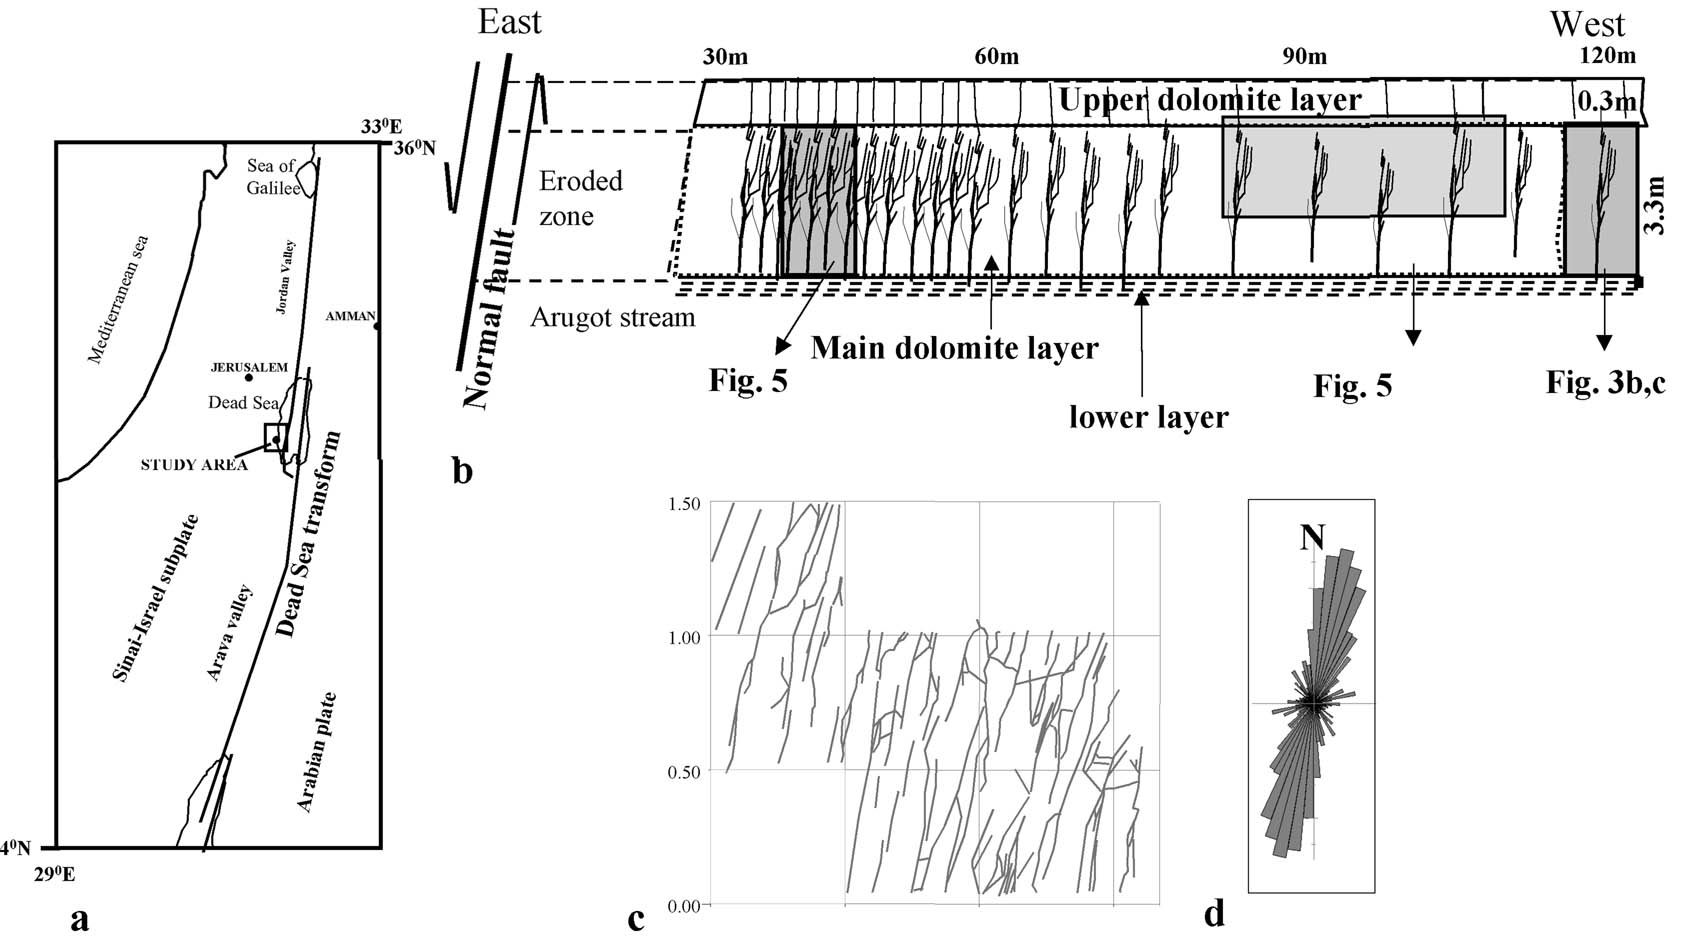
Fig. 2. (a) Location map of the study area
in the Dead Sea basin. (b) Schematic cross-section of a sub-vertical wall
in Arugot outcrop, western margins of Dead Sea basin; shown: the main dolomite
layer (3.3m thick), tree-like joints, the eastern normal fault and the
locations of the marked figures (shadowed rectangles); top scale indicates
distance in meters from the eastern fault. (c) A joint map on top of the
main dolomite layer at a distance of about 45m west of the fault; mapping
1.75m2 at 1:10 scale. (d) Rose diagram of joint strikes in the map shown
in (c).
Tree-like morphology of a single joint
An individual joint in the studied layer is a network of many short cracks arranged in a branching structure that is defined here as a "tree-like" joint. In Fig. 3a the main joint surface appears on the left side with one large secondary branch diverging to the right (lower part) and another, smaller secondary branch occurs about 7cm above the first. Tertiary branches diverge from the secondary ones, and frequently, after a distance of 1-3 cm, the secondary and tertiary branches parallel the main surface. Some of the branches link again to the parent fracture (Fig. 3a).
The joint of Fig. 3a is relatively simple
whereas the common fractures in this exposure are significantly more complex
as shown in Figs. 3b and 3c. These joints include a main surface that is
relatively long and which is composed of several quasi-planar segments
linked to each other. The main surface becomes irregular and crooked in
the upward direction and frequently the fracture terminates within the
layer (Fig. 3b). The secondary branches diverge with predominantly upward
direction (Fig. 3c).The branching angles, a,
(Fig. 4a) between the parent fractures and the branches
were measured along three tree-like joints; the mean value is 43.0°
± 22.5°
for the 298 measured angles (Fig. 4b). Most branching
fractures are a few centimeters long but some extend up to a few decimeters
from the parent fracture. Many of them curve to become parallel with the
main fracture (Fig. 3).
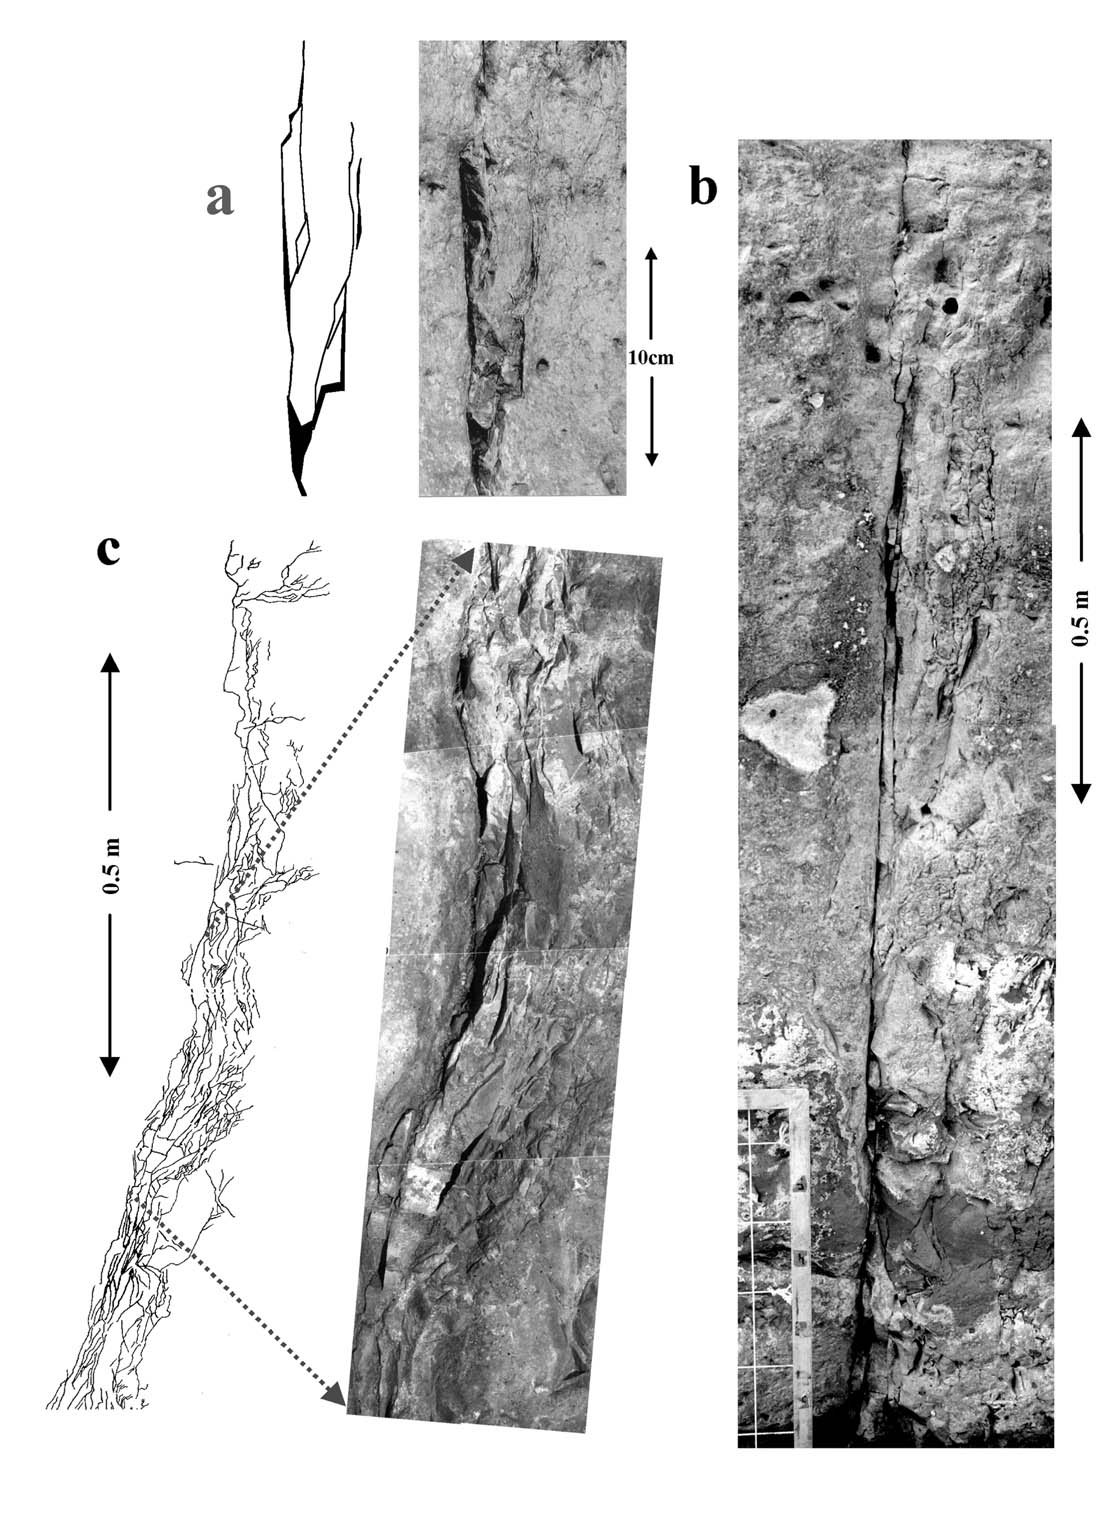
Fig. 3. Tree-like joints in a dolomite layer
(location in Fig. 2); note the upward branching, and parallelism of branches
to the main fracture. a. A relatively simple fracture shown by photograph
(right) and map (left). b. A large tree-like fracture with fairly smooth
main fracture. c. A complex, wide joint, photograph (right) and map (left);
note width of more than 10 cm, and upward narrowing of the tree structure.
The tree-like joints display up to ten levels of branching (eight levels shown in Fig. 4a). This multiple branching generates a joint which is a wide zone of intense fracturing ranging in width from 1cm to 15cm (Figs. 3b,c, 4a). Local high density of the branches leads to total fragmentation of parts of the rock (Fig. 3c). We mapped on a 1:1 scale all branches associated with a few large tree-like fractures observed on the 2D-exposure wall. The maps show a cumulative fracture length of 9-14m per meter of linear height of the main fracture; these results correspond to a surface-area of 9-14m2 per 1m2 of a planar fracture.
The abundance of branches is not constant even along a single joint. Branching intensity usually decreases upward along a typical joint, leading to a gradual upward narrowing of the tree-like joint (Figs. 3b,c). At a distance of ~100m west of the fault, four out of five joints terminate within the layer and do not cross the layer top (Fig. 5). This behavior changes dramatically eastward and at a distance of ~30m from the fault all major joints cross the layer top (Fig. 6).
The occurrence of tree-like joints in the field is reported here for the first time. The main morphological features of the tree-like joints in Arugot are the following:
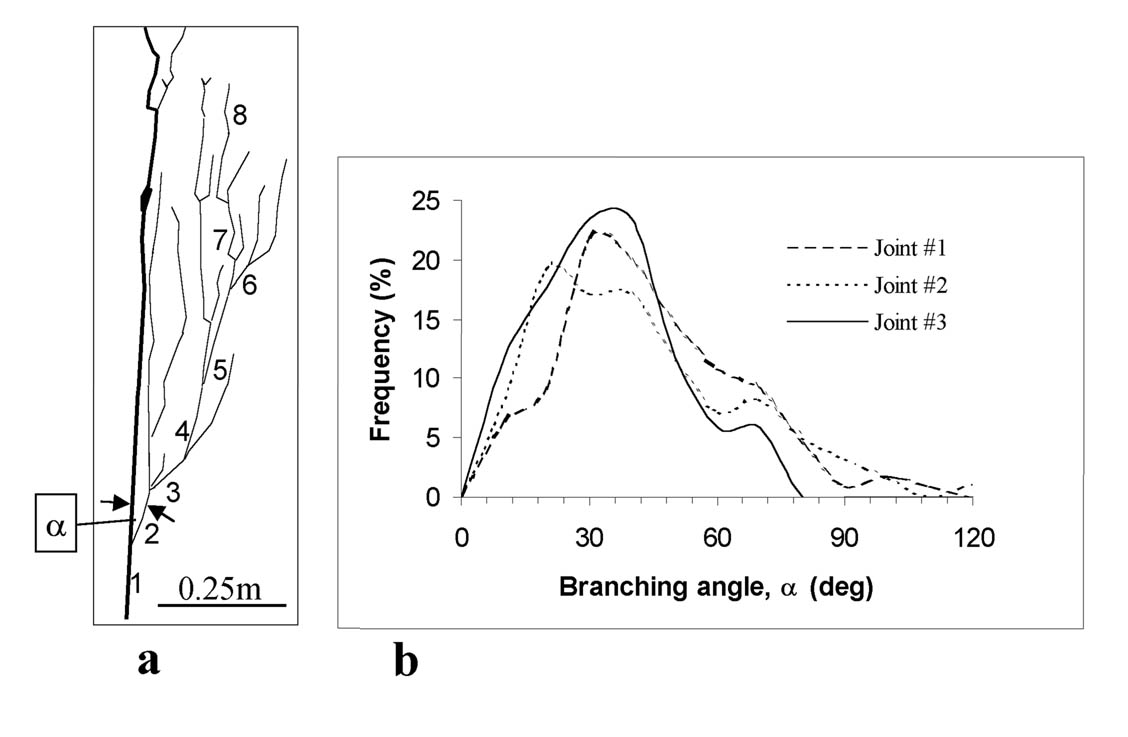
Fig. 4. a. Branching along a single tree-like
joint with eight marked offspring levels; heavy line indicates the main
fracture; ? marks the angle between the main fracture and branch level
2. B. Histograms of branching angles a along three joints; joint #2 shown
in Fig. 3c and joint #3 is the upper portion of Fig. 3b.
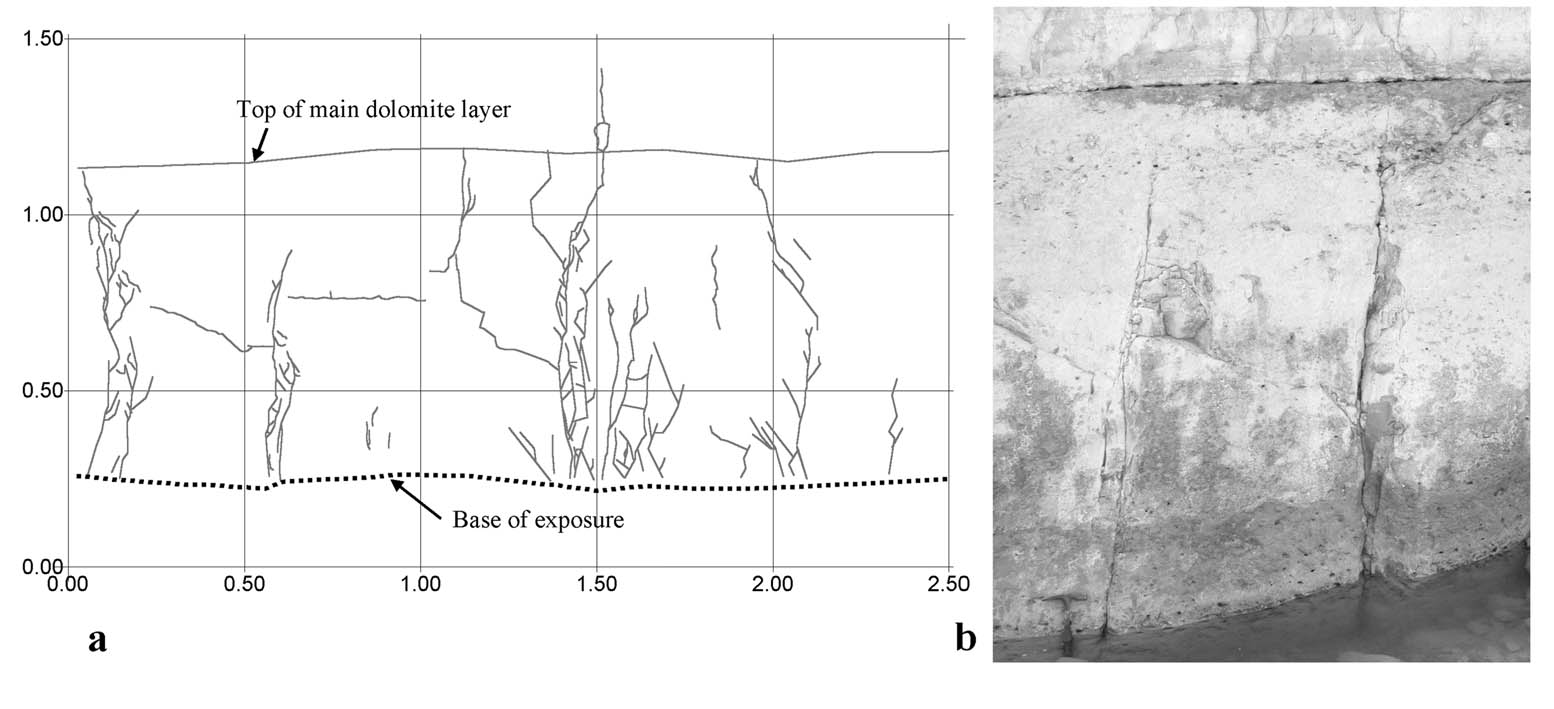
Fig. 5. Tree-like joints far away from the
fault. a. A cross-section view of several joints in the upper part of the
main dolomite layer at a distance of ? 80 m west of the fault (location
in Fig. 2). b. Photo of two joints at a distance of ? 95m west of the fault
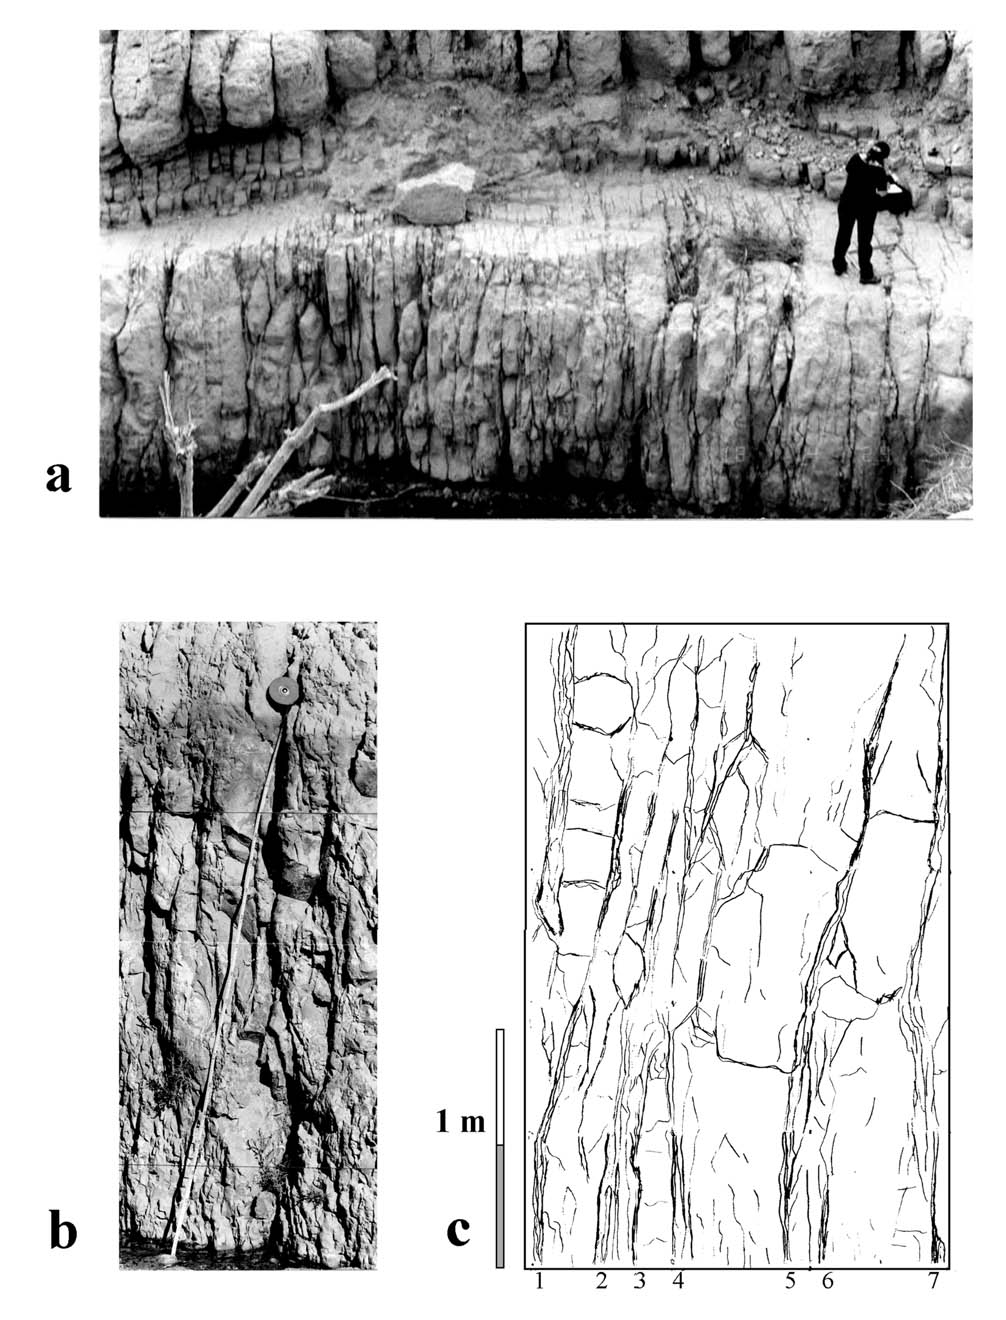
Fig. 6. High density of joints in Arugot exposure
(location in Fig. 2); general view (above) and close-ups below; note close
spacing and crosscutting relations of the fractures; e.g., in C one can
recognize at least seven tree-like joints.
Joint density
The distribution of tree-like joints varies in the studied exposure. At a distance of 90-120m west of the fault, the joints are spaced at 1-1.5m and the spacing is irregular (Figs. 2b, 5). Eastward, closer to the fault, the large joints become closely spaced with spacing of 0.2m-0.3m (Fig. 6c). The density of tree-like joints was calculated by the following procedure. First, the sub-vertical southern wall of the outcrop was mapped at scale of 1:20 between 60m and 120m west of the fault (location in Fig. 2b). Second, we logged all tree-like joints higher than 1.5m in the entire exposure (the interval 30m to 120m west of the fault); 295 tree-like joints were counted here. Each tree-like joint is counted once and its associated branches are ignored; for example, two, four and seven joints were counted in Fig. 5b, Fig. 5a and Fig. 6c, respectively. Third, the mean spacing of these tree-like joints was calculated for 5m long segments. The calculated values are for joint-normal spacing after a correction for the difference between joint orientation and outcrop orientation. Finally, the density of the tree-like joints was calculated for these segments in the interval 30m-120m. The density parameter is a slightly modified version of FSR, the 'Fracture-Spacing-Ratio' of Gross (1993),
FSR = T / ?
where T is the thickness of the mechanical host layer and ? is the mean joint spacing. Gross (1993) used median spacing for ? to better represent a positively skewed spacing distribution. The present work deals with lateral variations of the joint density in one layer, and thus the mean spacing provides a suitable presentation to the intensity of jointing.
The joint density increases significantly toward the fault (Fig. 7). FSR is about two at a distance of 80-100m west of the fault (Fig. 5), and it increases systematically to more then 20 at 30m distance from the fault (Fig. 6). This increase is associated with several structural changes. Four out of five tree-like joints terminate within the layer at distance of ~100m from the fault, whereas all tree-like joints cross the entire layer in the proximity of the fault (Fig. 6). Further, in the fault proximity, branches of neighboring tree-like joints coalesce with each other and the layer is totally fragmented (Fig. 6). The blocks between the fractures lose their continuity, large joints that cross the entire layer cannot always be distinguished from each other; for example, seven such large joints were labeled as 1-7 in Fig. 6c. The last 30m of the dolomite layer closest to the fault were eroded, most likely due to intense fragmentation. Possible mechanisms for this high joint density are discussed later.
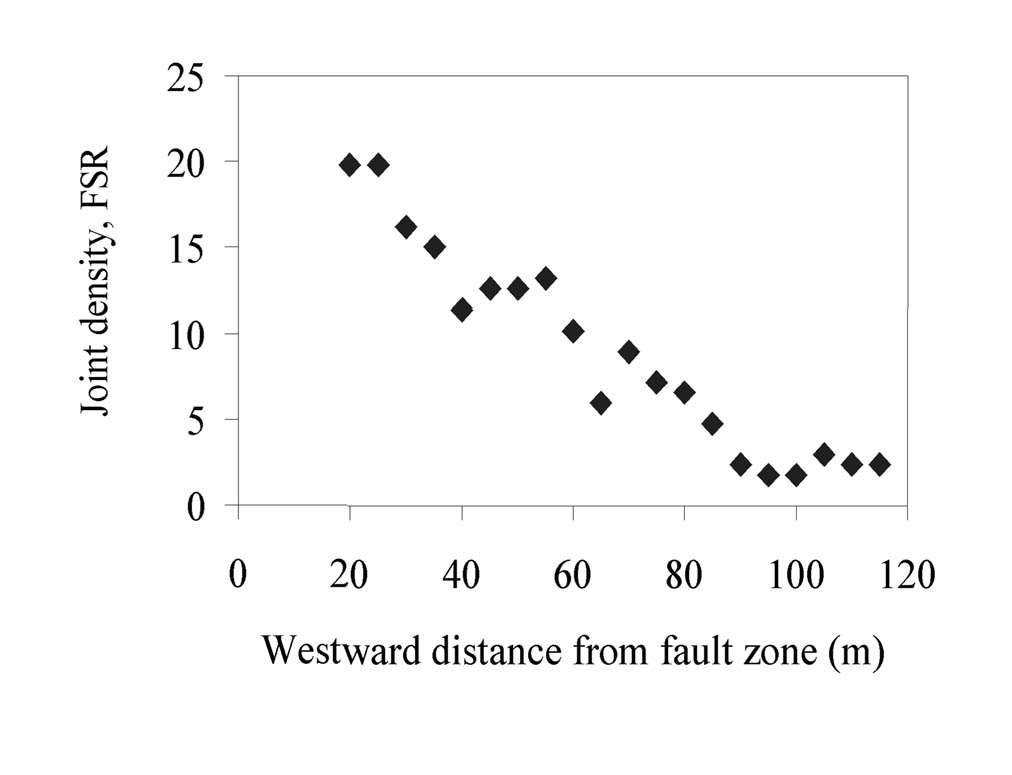
Fig. 7. Density of the tree-like large joints
(height > 2.0m) measured in 5m long segments along Arugot exposure; FSR
values are plotted as function of distance from the normal fault on the
east.
Experimental Work
Experimental Setup
We conducted a series
of tests with layered composites to explore the mechanisms of high density
jointing. Each sample includes three elongated layers. The upper and lower
ones are ductile polycarbonate layers, and the central one is brittle epoxy
(Fig. 8). Aluminum spacers were used as end-pieces to strengthen the gripping
zone of the sample (Fig. 8). The polycarbonate layers are 3mm in thickness,
200mm in length and 30mm in width, and the aluminum spacers are 1mm thick
and 30mm by 30mm (Fig. 8). The upper and lower polycarbonate layers were
cemented to each other by the brittle epoxy with the aluminum spacers at
the end zones. As a result, the 1mm thick central layer is divided into
three parts: an epoxy part that is 140mm in length and 30mm in width, and
two aluminum spacers that are 30mm by 30mm (Fig. 8). Material properties
are listed in Table 1. The polycarbonate is the product of Lexan; it can
sustain about 10% of extension without fracturing, and its tensile strength
is 65MPa. Axial extension was applied with an Instron 30kN press at room
temperature, atmospheric pressure and strain rates of ?
=3.6×10⁻⁵ sec-1
to ?=7×
10-3 sec-1. Continuous monitoring included axial
displacement, axial load, broadband acoustic emission and video recording.
The video-renable time resolution of 1/25 sec (Reches et al., 2000). In
a typical test, the fracturing started at 2%-4% extension. Most tests were
terminated when the polycarbonate layers yielded (by shear or tensile fracture),
or when the epoxy layer delaminated from the polycarbonate
Table 1. Mechanical properties of the components
of the composite samples. Measurements were conducted under strain rates
of 1-2× 10⁻³ sec-1.
| Young modulus (MPa) | Tensile strength (MPa) | Tensile strain at yielding | Rayleigh wave velocity (m/sec) | |
| Polycarbonate | 1,400 | 65 ± 5 | » 10% | |
| Transparent epoxy | 2,830 ± 540 | 39 ± 1.2 | 1.4 % ± 0.3 % | 810-840 |
The experimental work included six series of tests with up to ten samples in each. Three types of matrix/hardener epoxy were used: (1) transparent, fast cementing epoxy, supplied by Chemibond, Israel. This epoxy contains many bubbles that apparently do not affect the fracture patterns; (2) dark, epoxy steel; and (3) bright, "rock cement" glue by Makmolit. Tests with types (2) or (3) generated fracture patterns that are similar to those in published tests (Garrett and Baily, 1977; Rives et al., 1992; Wu and Pollard, 1995) and are not reported here.
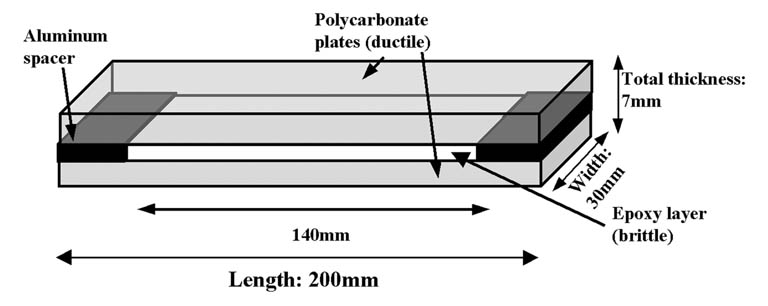
Fig. 8. Geometry of the samples used in the
present extension experiments (see text).
Eighteen samples with the transparent epoxy were tested. The tests differ
from each other by the applied extension velocity; the velocity range is
0.5-60 mm/min that corresponds to approximate strain rates of ?=3.6×
10-5 sec-1 to ?=7×
10-3 sec-1. The fracturing style of the epoxy depends
strongly on the applied strain-rate (Table 2). Under strain rates slower
than about 10-4
sec-1, the epoxy deformed continuously with only a few small
fractures developing close to the grippers. These fractures are attributed
to local gripping stresses. Strain rates higher than 10-4
sec-1 generates three different fracturing styles in the epoxy
layer that we term: planar, branching and clustering (Table
2).
| Fracturing style | Strain rate, ? (s-1) | Fracturing style | Fracture density, FSR |
| N0
|
<?10-4 | Continuous flow without fracturing of the epoxy. | NA |
| Planar | » 10-4 | Fractures are simple, planar and normal to extension axis; growth in few steps; some are shorter than sample width. | » 0.2 |
| Branching (Fig. 9a,b) | 10-3 | Microbranches and few macrobranches; tree-like morphology; many macrobranches deviate in trend from parent fracture | 0.25-2.5 |
| Clustering (Fig. 9c-f) | 2× 10⁻³ - 7× 10⁻³ | Clusters: each with many tightly spaced, branched fractures that grew during a fast single event; new clusters may crosscut existing ones; very tight local spacing; local fragmentation of the brittle layer | 10-13 |
Planar fractures
The multiple branching increases the surface area and generates a structure with finite width of up to 7mm. We measured the cumulative length of all branches associated with one branching fracture observed on the x6.7 magnification (Fig. 9b). This cumulative length is 178mm almost six times the length of a planar fracture across the sample. The mean branching angle in this fracture is 16.3° ± 8.5° , and most branches maintain their branching orientation through their entire length. Therefore, the fracture segments within a branching fracture may show a conjugate set on which the fractures significantly deviate from the expected tension-normal direction.
Two types of fracture spacing were measured in A56 test: (1) the spacing
between the 22 main branching fractures marked by tick arrows in Fig. 9a.
This measurement yielded mean spacing of 5.0 ±
1.8 mm for 23 fractures that are 1.5mm long or more. (2) the spacing of
all branches along a scan-line. This measurement yielded mean spacing of
2.3 ± 1.9 mm.

Fig. 9. Top view photographs of deformed, fractured
samples; scale in mm; circular features are air bubbles in the epoxy. a.
and b. Branching fractures in test A56. The fractures display a short planar
segment that forks into several branches in simple to complex fork structures;
each heavy arrow marked on the top indicates one branching fracture. c.
and d. Clustering fractures in test A58; each cluster is a group of branching
fractures that may be traced to its parent fracture. e. and f. Complex
network of crosscutting clusters.

Fig. 10. Multilevel branching in the dolomite
layer of Arugot (a) and in test A56 (b); numbers indicate branching level.
The experiments indicate that a clustering fracture grows during a single and fast event (Reches et al., 2000). This is demonstrated in Fig. 11 that displays sequences of consecutive frames from the video records of test A58; the time span between two consecutive frames is 0.04 sec. Clustering fractures appear here as dark structures on the gray background of the sample. This figure shows clearly that a cluster was fully developed during the time of a single frame: cluster A developed in frame #2, cluster B developed in frame #5 and cluster C developed in frame #7 (Fig. 11). The fully developed cluster may continue to dilate after the initial growth, for example, cluster B dilates from frame #6 to #7.
The general trend of the clusters is normal to the extension axis, however, the individual branches deviate significantly from the general trend. The mean branching angle for a single cluster in test A58 is 16.8°± 6.7° , which is the same as the 16.3°± 8.5° angle in test A56 of ? =1× 10⁻³ sec-1 (see above).
The intense fracturing within the cluster generated a fragmentation zone in the brittle layer. The cumulative length of the fracture segments inside a single cluster was measured under a 6.7 magnification. The measured length is 505 mm that is 17 times the length of a planar fracture across the sample. The average spacing between the central-lines of the clusters in sample A56 is 7.3 ± 2.2 mm. The fracture density increases profoundly in tests of ?»7× 10⁻³ sec-1 in which FSR » 10 for the entire sample and locally FSR » 13. This high fracture density reflects another new feature of clustering fractures: they crosscut and partly overlap each other (Figs. 9d, 12). This style is in clear contrast to previous experiments in which tensile fractures did not cross each other and did not form close to existing ones (Garrett and Baily, 1977; Rives et al., 1992; Wu and Pollard, 1995). The present experiments show that the development of clustering fractures is an efficient mechanism to fragment the brittle layer under quasi-static loading.
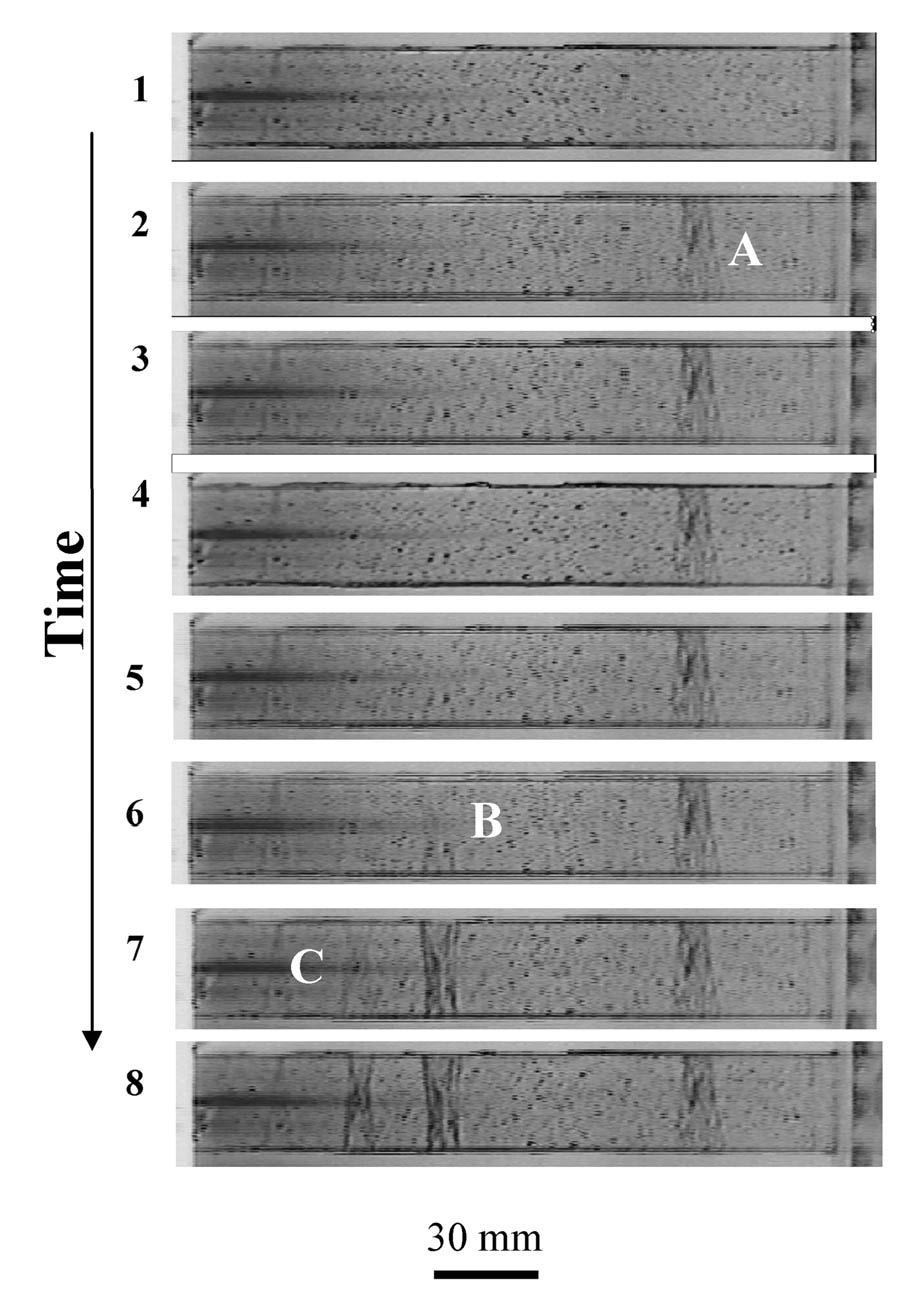
Fig. 11. Growth of fracture clusters displayed
by snapshots in test A58. For continuous video display in real time see
Reches et al., (2000). Clusters appear by dark structures on the gray background
of the sample; time progress is from frames 1 to 4 that are consecutive
snapshots with 1/25 sec between each pair; snapshots 5 to 8 are also consecutive
frames on the video records. A, B and C indicate stages of cluster appearance
and dilation (see text).
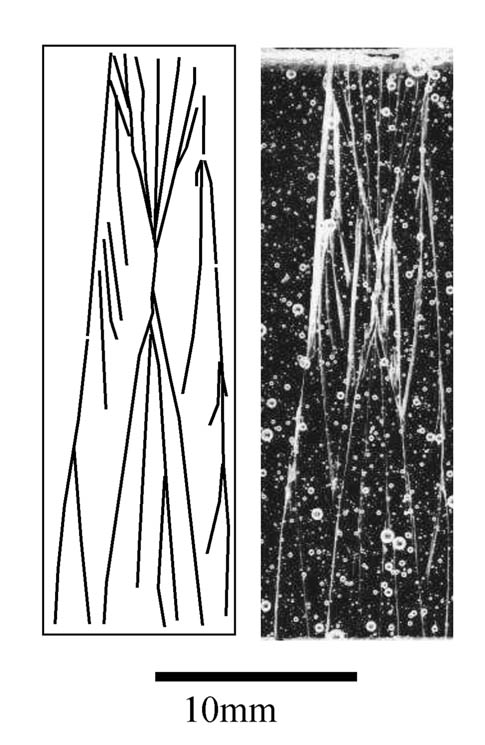
Fig. 12. Close-up of a simple cluster with
three (and more) branching fractures that formed simultaneously. Photograph
(right) and fracture tracing (left); note slight curving of some branches
that suggest interaction between the fractures.
The branches described above depart from the parent fracture at an angle of » 16° , and they propagated to a distance of a few millimeters (or more) without changing their orientations. These features are similar to macrobranches observed in fracturing tests of brittle plates (Fig. 1a) (Schardin, 1959; Ramulu and Kobayashi, 1985). Another type of branches, termed microbranches, appeared in the present experiments. The microbranches are short, up to 100m long, they depart from the parent fracture at an angle of » 30° and they curve to gradually parallel to the parent fracture (Fig. 13a). The microbranches geometry fits the form of y µ a xb (Fig. 13b), where x is the distance along the parent fracture, y is the distance normal it, and a and b are constants. The measured microbranches have b » 0.77± 0.01, and a ranges from 0.07 to 0.76. The geometry of the microbranches in the epoxy layers is similar to the microbranches observed along dynamic fractures in glass and PMMA (Sharon and Fineberg, 1999) (Fig. 13c). Further, the determined b value is essentially identical to the b = 0.70 found by Sharon and Fineberg (1996).

Fig. 13. Microbranches along dynamic fractures.
a. Microbranches along fractures in the epoxy layers of present experiments:
thin, dark, curved lines that branch upward from the main, thick fracture.
b. Geometry of microbranches in plates of glass (open circle) and PMMA
(solid squares) (after Sharon and Fineberg, 1999). c. Geometry of microbranches
in the epoxy layers measured by digitizing along the microbranches; each
symbol refers to a different microbranch; thin line indicate best fit power-law
curve; in b and c, the main fracture propagated horizontally from
left to right (positive x) and branching direction is to the right and
downward (see inserts); note similarity of slopes in b and c (see text).
Propagation velocity of the epoxy fractures
One of the objectives was to determine the velocity of fracture propagation in the epoxy layers. Our attempts were successful only for the slow propagating fractures that could be traced on the video records (Reches et al., 2000). Howev, the velocity of the fast growing fractures exceeded the available techniques and we could only estimate a lower bound on thivelocity. From Fig. 11 that displays sequences of consecutive frames from test A58, we estimated a minimum fracture velocity to cross the 30mm of sample width within one video frame of 0.04 sec as 0.75 m/sec.
On the other hand, several morphological features of the fractures in the present experiments suggest higher propagation velocities for most fractures in tests of ? ³ 1× 10⁻³ sec-1. First, previous tensile experiments of brittle plates show that micro- and macro- branches develop only along dynamic fractures (Ramulu and Kobayashi, 1985; Lawn, 1993; Sharon and Fineberg, 1996). Similarly, the fractures in the present experiments display intense branching and microbranching in tests subjected to strain rates of 1-7× 10⁻³ sec-1 (see above). Second, the geometry of the microbranches in the epoxy is essentially identical to that in the glass and PMMA (Fig. 13b,c). The Rayleigh wave velocity of the epoxy used here is 810-840 m/sec (kindly measured by E. Sharon, 1999). Using the Vc»0.4 VR as the critical velocity needed for microbranches development (Sharon and Fineberg, 1996), the minimum value for the propagation velocity of the clustering fractures is about 325 m/sec.
Discussion
Propagation velocity of the tree-like joints in Arugot
It is proposed here that the tree-like joints in Arugot outcrop propagated at dynamic velocities. This deduction is based on two central observations. First, the tree-like joints mapped in the field are similar in morphology to dynamic fractures observed in experiments (Table 3). The striking similarities include multiple branching (up to nine orders in Fig. 10), common occurrence of a main fracture with many secondary ones (Fig. 14), tendency of many branches to parallel the main fracture (Fig. 1b, 3), and the general shape similarly over two orders of magnitudes in dimensions (Figs. 10, 14). We also note the dissimilarity of macrobranching angles that are » 45° in the dolomite, » 16° in the epoxy tests.
| Tree-like joints in the field (present work) | Fractures in layered composites (present work) | Fractures in brittle platesA | |
| Macrobranching | Branching up to nine orders; branching angle » 45° ; curving to parallel main fracture (Figs. 3,4,5) | Branching up to eight orders; branching angle » 16° ; curving to parallel main fracture (Figs.9,10) | Branching in several orders (Fig. 1a) |
| Microbranching | Up to 100m long,
curved shape of the relations
|
Up to 100m long, curved shape of the relations y a x0.7, appear above critical velocity (Figs.1b,13) | |
| Fracture density | Very high density (FSR > 22.0) (Figs. 6,7) | High density (local values FSR» 13) (Fig.9e,f) | |
| Surface area | 9-14 times the area of a smooth fracture | Significant increase | Six times the area of a smooth fracture |
| Propagation
|
Deduced to be dynamic, thus,
V >1100 m/sec (B) |
Deduced to be dynamic thus,
Þ V > 325 m/sec |
Dynamic velocity:
|

Fig. 14. Morphological similarity of macrobranches
in dolomite (left), PMMA plate (center) and epoxy (right); note scale differences.
E. Sharon kindly provided the PMMA sample.
The second observation is the profound increase of the surface area. Our field measurements revealed that the surface area of a tree-like joint is 9-14 times the surface area of a smooth one; this is a conservative estimate as it is based on mapping at scale of 1:1, and surface area increase at microscopic scale is not accounted. Similar intensity of surface area increase was observed in experimental dynamic fractures. In the present work, the dynamic fractures in the epoxy layers display 6 to 17 times increase in surface area with respect to a planar fracture (Figs. 9, 10b). Also, the cumulative surface area of a fracture that grows at the terminal velocity, VT » 0.7 VR, is six times the surface area of a planar fracture (Sharon and Fineberg, 1996). These authors showed that the increase of surface area prevents fractures from reaching the theoretical velocity VR, because ...the system chooses not to dissipate the excess energy... by increasing the crack velocity, but to divert the energy into the creation of additional surface area. It is postulated here that the surface area increase associated with tree-like joints indicates dynamic propagation velocities similarly to glass and PMMA.
To estimate the propagation velocity of the dynamic joints in Arugot, we use the clear experimental observation that micro- and macro- branches and the profound increase of surface area are associated only with fractures that propagate at velocities above 40% of Rayleigh wave velocity (see section 2). As discussed above, branching and surface area increase are intrinsic features of dynamic fracturing. Thus, based on the tree-like morphology and surface area increase (Table 3), one can deduce that the growth velocity of Arugot joints was significantly larger than the critical velocity (also Sharon, personal communication, 1999). The mean Rayleigh wave velocity for dolomites is VR » 2,750 m/sec (Mavko et. al., 1998), therefore the estimated propagation velocity for Arugot joints is V > VC » 1,100 m/sec.
This inference that Arugot joints propagated dynamically raises two important questions. The first is related to the propagation direction of dynamic fractures in layered media. Experiments on dynamic fracturing were conducted with 2D single, unconfined plates (Fig. 1) (Schardin, 1959; Ravi-Chandar and Knauss, 1982; Sharon & Fineberg, 1996), or with layered media of a thin brittle layer between thicker, ductile ones (present experiments, Fig. 8). The dynamic fractures in these experiments propagated primarily parallel to the plate (or layer) surfaces. The dominant propagation direction in Arugot outcrop is apparently different: it is normal to the surface of the dolomite layer, as evident by the branching direction observed on the sub-vertical outcrop wall (Fig. 3). Due to limited field exposure of this joint set, one cannot observe evidence for (or against) layer-parallel propagation (Fig. 2c). Our above deduction that Arugot joints propagated at dynamic velocities was based on observations of surface area, intense branching and high joint density; these features are not related to bedding surfaces or layer-parallel anisotropy. Therefore, we think that the apparent difference in the relative propagation direction between field and experiments should not change the main results.
The second question is related to the rate of loading associated with Arugot dynamic joints. There are few cases of fracturing that clearly indicate high loading rates. For example, shatter cones that are associated with meteorite impacts, or fragmentation and pulverization under explosive condition (Grady and Kipp, 1987). On the other hand, branching fractures in brittle plates look similar for different loading rates (Schardin, 1959; Sharon and Fineberg, 1996). Therefore, in general, one cannot discriminate between dynamic fractures that develop under high loading rates and those which developed under quasi-static loading. It is likely that the dolomite layers in Arugot were subjected to quasi-static extension, which is typical for geological processes. However, the immediate proximity of the studied exposure to a large normal fault (Fig. 2b) suggests that high loading rates associated with earthquakes could also be important to the dynamic nature of the fracturing.
Fracture clustering: a new fracturing style
To the best of our knowledge, the present experiments are the first report of dynamic fracturing in a layered sequence of brittle and ductile layers. In addition to known forms of planar fractures and branching fractures (Fig. 9a,b), the experiments revealed a new style of fracturing that is termed here fracture clustering (section 4.2.3 and related figures; Reches et al, 2000). Fracture clustering is most likely controlled by the layered nature of the samples; however, at the present stage of the research, the exact mechanism of this process is unknown.
The unique features of this style are:

Fig. 15. Tensile fractures within a brittle
SiC fiber embedded in titanium alloy matrix (after Roman et al., 1992);
note complex branching in the three groups of fractures.
Fracture clustering and high density of joints
High joint density was found in Arugot exposure, FSR > 20.0 in the proximity
of a normal fault (Fig. 7). The compilation of some previous field observations
(Fig. 16) displays two distinct groups of fracture density. Group A with
low FSR values of 0.5-3.0 that many field outcrops with joint density of
FSR » 1.0 (Narr and Suppe, 1991; Gross,
1993). Group B with higFSR values of 1.0-22.0; the present results clearly
belong to this group.
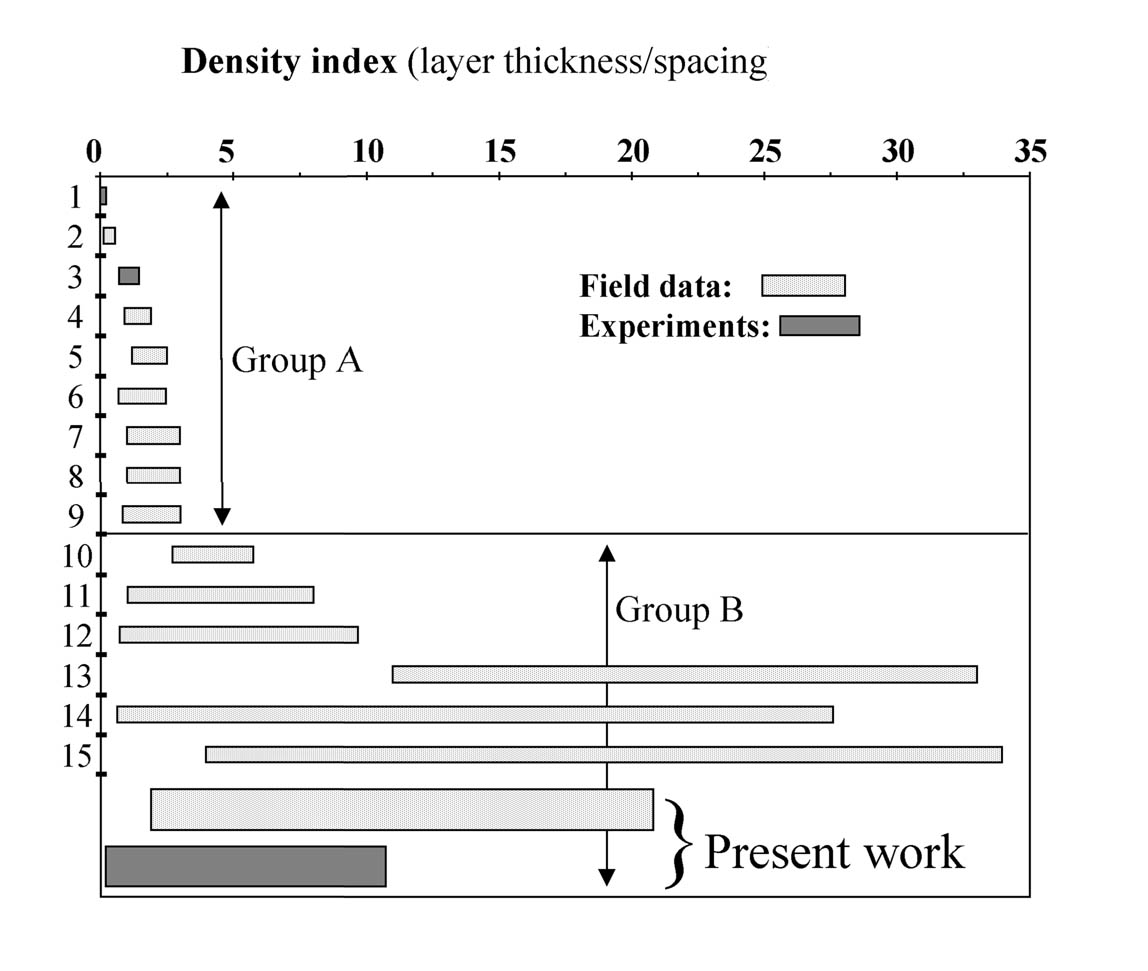
Fig. 16. Compilation of joint (and fracture)
density in the field and in experiments; each rectangle shows the minimum
(left) and maximum (right) values of FSR measured in the published data;
lowest two rectangles are for the present work. Sources are the following:
1, 4- Wu & Pollard (1995); 2, 5- Narr & Suppe (1991); 3- Garrett
& Baily (1977); 6- Gross (1993); 7- Huang & Angelier (1989);
8- Price (1966); 9- Gross et al., (1995); 10- Rives et al., (1992); 11-
McQuillan (1973); 12- Becker & Gross (1996); 13- Reches (1998); 14-
Reches (1972); 15- Ladeira & Price (1981).
The density of opening mode fractures in layered media was studied in several experimental works (Garrett and Baily, 1977; Rives et al., 1992; Wu and Pollard, 1995). The tested layered samples were subjected to layer-parallel extension, and typically, one set of fractures developed in the brittle layer normal to the direction of extension. Fracture density increased with increasing extension up to a stage termed fracture saturation (Narr and Suppe, 1991; Rives et al, 1992; Wu and Pollard, 1995). During this stage, new fractures cease to develop, existing fractures dilate, and eventually the ductile layers fail (Wu and Pollard, 1995) or delaminate from the brittle layers (Roman et al., 1992). The fracture density during saturation reaches a maximum value of FSR » 1.0 (Garrett and Baily, 1977; Rives et al., 1992; Wu and Pollard, 1995) (Fig. 16).
Theoretical models of joint density in brittle/ductile layered composites are usually based on the assumption that an existing joint creates a stress shadow due to drop of the tensile stresses at its proximity (Price 1966; Hobbs, 1967; Sowers, 1973; Gross et al., 1995; Ji et al., 1998; Bai and Pollard, 2000). The tensile stress rise gradually with distance from the joint, until they exceed rock strength and a new joint forms. Some of these models predict an upper limit on the density values, FSR £ 1.0, that is attributed to the stress shadow and the finite strength (or finite modulus) of the ductile layers. Thus, the high density of joints (group B in Fig. 16) contradicts the stress shadow concept. Other mechanisms were proposed to explain the high-density observations. For example, Ladeira and Price (1981) proposed repeated hydraulic fracturing, and Becker and Gross (1996) suggested local strain increase.
The present experimental results of dynamic fracturing in layered media raise a new mechanism for high fracture density. The clusters of fractures observed in the present experiments display very high density of tensile, branching fractures in the brittle layer (Fig. 9e,f). The cumulative length of fractures in the cluster indicates density values of FSR > 10.0. Each cluster grows during a single dynamic event and initially, the clusters are widely spaced (Figs. 11, 17a) (Reches et al., 2000). As extension increases, new clusters fill the unfractured regions (Fig. 17b), and eventually, clustering stops when a final spacing Sf between the clusters is attained (Fig. 17c). In the present experiments, Sf between branching and clustering fractures is similar to Sf between planar fractures (Fig. 17d). However, the surface area of the fractures within the clusters is very high; for example, in a strain rate of 1·10-3 sec-1 the cumulative fracture length is six times larger than the length of a planar fracture formed under strain rate of 6·10-4 sec-1. At strain rates of 2·10-3 - 7·10-3 the fracture length within a single cluster is 17 times the length of a planar fracture. It is apparent that the final high density of dynamic fractures within a layered medium reflects two independent factors: the internal cumulative surface area of a single complex fracture or cluster (FSR > 10.0), and the wide spacing between the individual complex fractures (FSR < 1.0).
Using the above concept, we suggest that the high joint density measured
in Arugot reflects the increased surface area of tree-like joints and clusters
during dynamic fracturing. The gradual increase of density toward the fault
probably indicates a gradual strain increase along the layer and toward
the fault. Finally, the observed fragmentation reflects overlapping of
clustering and branching fractures, a phenomenon observed in our experiments
(Fig. 9e) and recognized in the field (Fig. 6).

Fig. 17. Development of high fracture density
by dynamic fracturing in a layered medium. a. The first cluster forms with
SA cumulative fracture length inside the cluster (see text); b. and c.
Extension increase and new clusters fill the unfractured regions with final
spacing Sf between clusters (FSR < 1.0). Final density of the dynamic
fractures is composed by intra-cluster density of a single cluster (SA/W),
and the sum of all clusters. d. Relations between intra-cluster density
and density of individual clusters (FSR=T/Sf) in three experiments (A53,
A56 and A58).
Conclusions
The present work indicates that dynamic propagation velocity can be recognized by the tree-like morphology of individual joints in the field and by their tight spacing. These two criteria allow the recognition of fast fracturing during past catastrophic events. These criteria could eventually provide a solution for a long-standing enigma of recognizing paleoseismic events by the morphology of a fault zone and its associated fractures.
A new class of fractures, the clustering fractures, are analyzed here for the first time. This class of fracturing in brittle/ductile composites is an effective mechanism to generate closely spaced joint in the field and experiments.
Acknowledgements
Discussions with Jay Fineberg, Eran Sharon, Leonid Germanovich and Dov Bahat are greatly appreciated. The careful reviews of Terry Engelder and Michael Gross significantly contributed to the quality of the manuscript. Thanks to Rod Holcombe for the permit to use the GeOrient program. The study was supported by "The Alexander Silberman Hebrew Univ. Foundation for Applied Science", "Minerva Dead Sea Research Center, Tel-Aviv Univ." and the "US-Israel Binational Science Foundation".
Bahat, D., 1991. Tectono-fractography. Springer-Verlag, Heidelberg, 354pp.
Becker, A., Gross M.R., 1996. Mechanism for joint saturation in mechanically layered rocks; an example from southern Israel. Tectonophysics 257, 223-237.
Dally, J.W., 1979. Dynamic photoelastic studies of fracture. Experimental Mechanics 19, 349-361.
Engelder, T., Fischer, M.P., 1996. Loading configurations and driving mechanisms for joints based on the Griffith energy-balance concept. Tectonophysics 256, 253-277.
Fineberg, J., Gross, S.P., Marder, M., Swinney, H.L., 1992. Instability in the propagation of fast cracks. Physical Review B45, 5146-5154.
Fineberg, J., Marder, M., 1999. Instability in dynamic fracture. Physics Reports 131, 1-108.
Freund, L.B., 1990. Dynamic Fracture Mechanics. Cambridge University Press, 563pp.
Garfunkel, Z. 1981. Internal structure of the Dead Sea leaky transform (rift) in relation to plate kinematics. Tectonophysics 80, 81-108.
Garfunkel, Z., Ben-Avraham, Z., 1996. The structure of the Dead Sea basin. Tectonophysics 266, 155-176.
Garrett, K.W., Baily, J.E., 1977. Multiple transverse fracture in 90º cross-ply laminates of a glass-reinforced polyester. Journal of Material Sciences 12, 157-168.
Grady, D.E., Kipp, M.E., 1987. Dynamic rock fragmentation. In: Atkinson B.K (Ed.), Fracture Mechanics of Rock, Academic Press, London, pp. 429-475.
Gross, M.R., Fischer, M.P., Engelder, T., Greenfield, R.J., 1995. Factors controlling joint spacing in interbedded sedimentary rocks; integrating numerical models with field observations from the Monterey Formation, USA. In: Ameen, M.S. (Ed.), Fractography: Fracture Topography as a Tool in Fracture Mechanics and Stress Analysis. Geological Society Special Publication 92, pp. 215-233.
Gross, M.R., 1993. The origin and spacing of cross-joints; examples from the Monterey Formation, Santa Barbara coastline, California. Journal Structural Geology 15, 737-751.
Hobbs, D.W., 1967. The formation of tension joints in sedimentary rocks; an explanation. Geological Magazine 104, 550-556.
Huang, Q., Angelier, J., 1989. Fracture spacing and its relation to bed thickness. Geological Magazine 126, 355-362.
Ji, S., Zhu, Z., Wang, Z., 1998. Relationship between joint spacing and bed thickness in sedimentary rocks; effects of interbed slip. Geological Magazine 137, 637-655.
Katz, O., Reches, Z., J-C. Roegiers, 2000, Evaluation of mechanical rock properties using a Schmidt Hammer. International Journal of Rock Mechanics and Mining Sciences 37, 723-728.
Kulander, B.R., Barton, C.C.S., Dean, L., 1979. The application of Fractography to core and outcrop fracture investigations. US Department of Energy, Morgantown Energy Technology Center, Morgantown, W.Va. 174pp.
Ladeira, F.L., Price, N.J., 1981. Relationship between fracture spacing and bed thickness. Journal of Structural Geology 3, 179-183.
Lawn, B.R., 1993. Fracture of britsolids. Cambridge University Press, Chapter 4, 86-105.
Mavko, G., Mukerji, T., Dvorkin J., 1998. The rockphysics handbook. Cambridge University Press, Chapter 10, 329 p.
McQuillan H., 1973. Small-Scale Fracture Density in Asmari Formation of Southwest Iran and its Relation to Bed Thickness and Structural Setting. American Association of Petroleum Geologists Bulletin 57, 2367-2385.
Narr, W., Suppe, J., 1991. Joint spacing in sedimentary rocks. Journal of Structural Geology 13, 1037-1048.
Price, N.J., 1966. Fault and joint development in brittle and semi-brittle rock. Oxford, England, Pergamon press, 176pp.
Ramulu, M., Kobayashi, A.S., 1985. Mechanics of crack curving and branching - a dynamic fracture analysis. International Journal of Fracture 27, 187-201.
Ravi-Chandar, K., 1998. Dynamic fracture of nominally brittle materials. International Journal of Fracture 90, 83-102.
Ravi-Chandar, K., Knauss, W.G., 1982. Dynamic crack tip stresses under stress wave loading - a comparison of theory and experiment. International Journal of Fracture 20, 209-222.
Ravi-Chandar, K., Knauss, W.G., 1984. An experimental investigation into dynamic fracture: I. Crack initiation and arrest. International Journal of Fracture 25, 247-262
Ravi-Chandar, K., Knauss, W.G., 1984. An experimental investigation into dynamic fracture: II. Microstructural aspects. International Journal of Fracture 26, 65-80.
Reches, Z., 1972. Jointing in the Hazera and Hathira monoclines, northern Negev. M.Sc. thesis, Hebrew University, Jerusalem, (Hebrew with Abstract in English).
Reches, Z., 1987. Mechanical aspects of pull-apart basins and push-up swells with applications to the Dead Sea transform. Tectonophysics 141, 75-88.
Reches, Z., 1998. Tensile fracturing of stiff rock layers under triaxial compressive stress states. In: Orozco J., Schmitter J. (Eds.), NARMS 98: 3rd North American Rock machanics symposium, International Journal of Rock Mechanics and Mining Sciences and Geomechanics Abstracts. 35; 4-5, pp. 456-457.
Reches, Z., Sagy, A., 1999. Fault-parallel joints and normal faults along the Dead Sea basin: fault growth in a 3D-strain field. EOS, Transactions, American Geophysical Union 80, 17, 328.
Reches, Z., Sagy, A., Roman, I, 2000, Dynamic fracturing: experimental observations of dynamic fracturing in layered sample, http://earth.es.huji.ac.il/reches/dynamic/.
Rives, T., Razack, M., Petit, J.P., Rawnsley K.D., 1992. Joint spacing; analogue and numerical simulations. Journal of Structural Geology 14, 925-937.
Roman, I., Krishnamurthy, S., Miracle, D.B., 1992. Interfacial shear properties and acoustic emission behavior of model aluminum and Titanium matrix composites. Proceedings 4th International Symposium on Acoustic Emission Composite Materials, ASNT, Seattle, 109-114.
Sagy, A., 1999. Jointing and faulting processes along the western margins of the Dead Sea basin. M.Sc. Thesis. Institute of Earth Science, Hebrew University, Jerusalem, (Hebrew with Abstract in English).
Schardin, H., 1959. Velocity effects in fracture. In: Averbach B.L. et al. (eds.), Fracture, MIT Press, pp. 297-330.
Sharon, E., Fineberg J., 1996. Microbranching instability and the dynamic fracture of brittle materials. Physical Review 54, 7128-7139.
Sharon, E., Fineberg J., 1999. Confirming the continuum theory of brittle fracture for fast cracks. Nature 397, 334-336.
Sowers, G.M., 1973. Theory of Spacing of Extension Fracture. Engineering Geology Case 9, 27-53.
Wu, H., Pollard, D.D., 1995. An experimental study of the relationship
between joint spacing and layer thickness. Journal of Structural Geology
17, 887-905.